
Why distance alone does not predict mobile coverage
Two places at the same distance from a mast can receive very different signal. Free-space loss sets the baseline; frequency, terrain and buildings decide the rest.
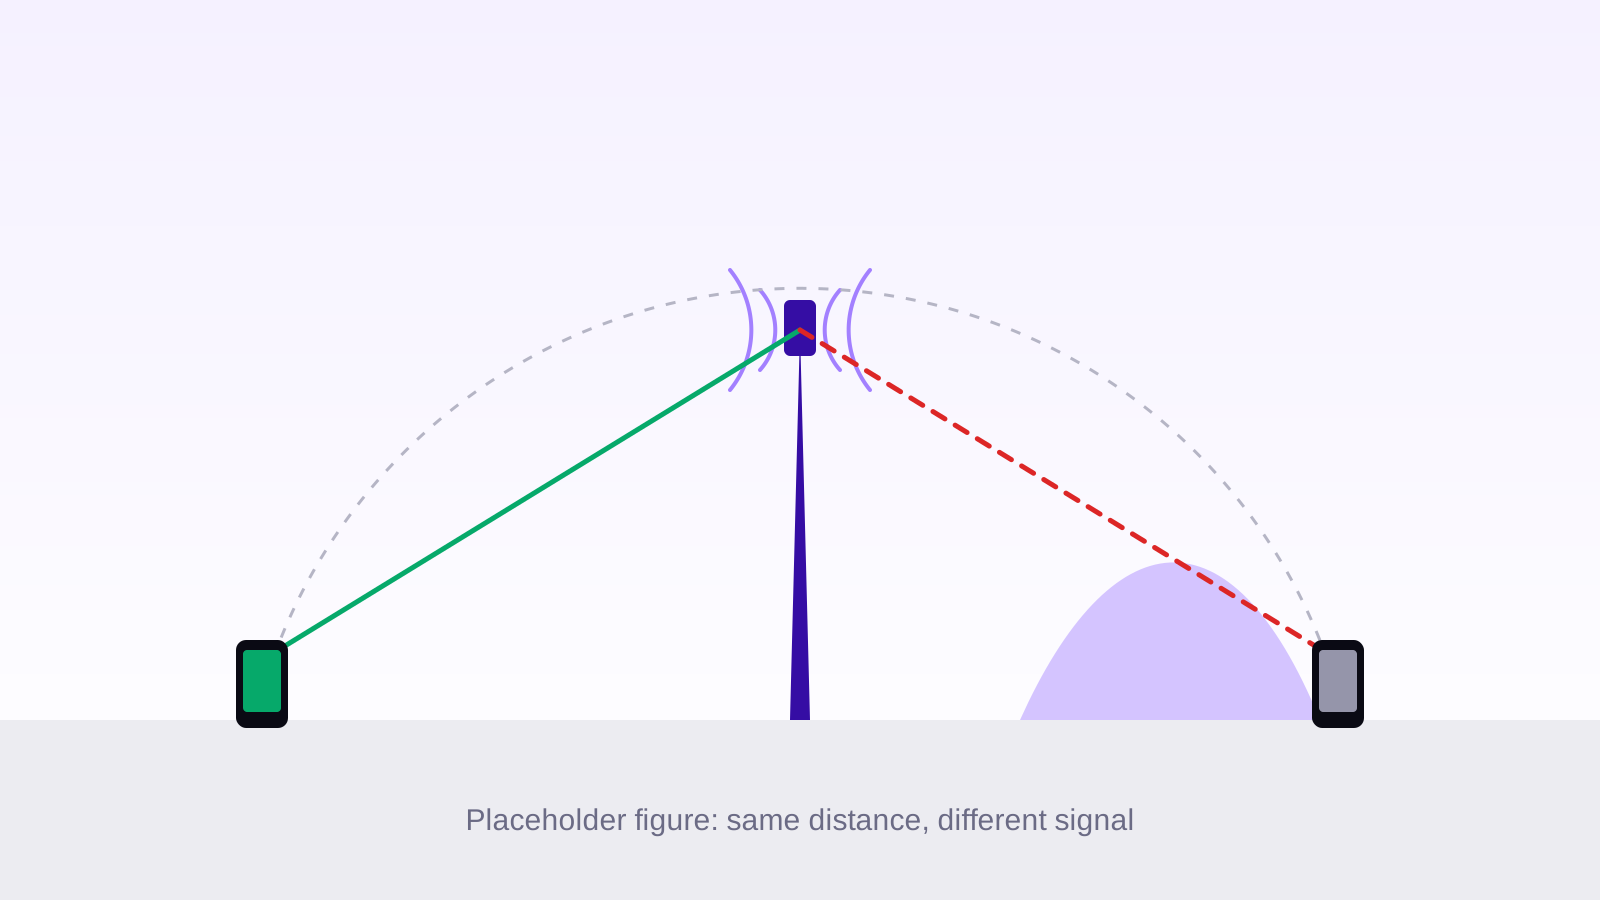
Coverage is often pictured as a circle around a mast: inside the circle you have signal, outside you do not. Real networks do not behave like that. Two places at the same distance from the same antenna can receive signals that differ by a factor of a thousand, and a phone a few kilometres away can be better served than one a few hundred metres away. Distance matters, but it is only the first of several terms in the calculation.
The baseline: free-space loss
In empty space, the power radiated by an antenna spreads over an ever larger sphere, so the power a receiver collects falls with the square of the distance. Recommendation ITU-R P.525 [1] gives this free-space basic transmission loss, in decibels, between two isotropic antennas:
 (1)
Two consequences follow. Each doubling of the distance adds about 6 dB of loss, which means a quarter of the power. Each tenfold increase adds 20 dB, a hundredth of the power. Free space is also the best case: it assumes nothing at all between the antenna and the phone. Everything else in this article only adds loss on top of it.
Frequency changes the picture
The same formula has a frequency term. Moving from the 700 MHz band to the 3.5 GHz band multiplies the frequency by five, which adds 20 × log10(5), about 14 dB, at every distance. Strictly speaking, the air does not absorb the higher frequency more: the term comes from the receiving antenna, whose effective capture area shrinks as the wavelength gets shorter.
| Band | Loss at 1 km | Loss at 10 km |
|---|---|---|
| 700 MHz | 89.3 dB | 109.3 dB |
| 1800 MHz | 97.5 dB | 117.5 dB |
| 3500 MHz | 103.3 dB | 123.3 dB |
This is why operators use the low bands, 700 and 800 MHz, to cover wide rural areas and to reach inside buildings, and the mid bands, from 1800 MHz to 3.5 GHz, to add capacity where people are. A 3.5 GHz cell carries far more traffic, but over a smaller area. Higher frequencies also lose more through walls and windows: the outdoor-to-indoor penetration models of 3GPP TR 38.901 [3] grow with frequency for every building material they describe.
Terrain and obstacles
A radio wave does not travel as a thin ray. The energy that reaches the receiver fills an ellipsoid around the direct path, the first Fresnel zone, whose radius at a point of the path is given in Recommendation ITU-R P.526 [2]:
 (2)
In the middle of a 10 km path, that radius is about 33 m at 700 MHz and about 15 m at 3.5 GHz. A hill or a row of buildings can therefore weaken the signal without ever cutting the straight line between the antenna and the phone.
Diffraction: the signal bends, at a cost
When an obstacle does cut the path, the signal does not stop dead: it bends over the edge, but loses power doing so. With the knife-edge model of ITU-R P.526 [2], an obstacle whose top just touches the direct line already costs about 6 dB, and the loss grows quickly as the obstacle rises above it. Behind a ridge, losses of 20 dB or more are common. Low frequencies bend more easily, so the shadow behind a hill is shallower at 700 MHz than at 3.5 GHz.
- more loss each time the distance doubles, in free space
- 6 dB
- more free-space loss at 3.5 GHz than at 700 MHz
- 14 dB
- lost to an obstacle that just touches the direct path
- 6 dB
Buildings, trees and the type of area
Towns add their own losses. Buildings block, reflect and scatter the signal, and trees absorb part of it. This is why 3GPP TR 38.901 [3] defines separate path loss models for urban macro cells, urban street-level cells and rural macro cells, each with a line-of-sight and a non-line-of-sight variant. In its urban macro model without line of sight, the loss grows by about 39 dB for each tenfold increase in distance, against 20 dB in free space. At the same distance, the gap between a street with a view of the antenna and one hidden behind buildings reaches tens of decibels.
Putting it together
The useful question is therefore not how far you are from a mast, but how much signal is lost between this antenna and this place, in this band, over this terrain, in this kind of area. The answer is then compared with what a phone needs to hold a connection and to reach a given speed. A map that draws circles answers the first question; a coverage map has to answer the second.